
Thermodynamics of animal locomotion
15 Nov 2020This paper is a foundation of thermodynamics of animal locomotion. It builds on previous paper that discussed the metabolic behaviour (here) of living system and the notion of adaptability for living organism (here)
Author
E. Herbert, H. Ouerdane, Ph. Lecoeur, V. Bels and Ch. Goupil
Download
The paper was accepted on November 2020 in Phys. Rev. Lett.. For the moment, it can be found on Phys. Rev. Lett. website
Abstract
Muscles are biological generators of mechanical power. They have been extensively studied in the frame of Hill’s classic empirical model as isolated biomechanical entities, which hardly applies to a living body subjected to internal and environmental constraints. Here we elucidate the overarching principle of a \emph{living} muscle action for a specific purpose such as locomotion, considering it as an assembly of chemical-to-mechanical energy converters (muscle units) connected in parallel, under mixed boundary conditions. Introducing the energy cost of effort, COE−, as the generalization of the well-known oxygen cost of transport, COT, in the frame of our compact locally linear non-equilibrium thermodynamics model, we analyze oxygen consumption measurement data from a documented experiment on energy cost management and optimization by horses moving at three different gaits. Horses adapt to a particular gait by mobilizing a nearly constant number of muscle units minimizing waste production per unit distance covered; this number significantly changes during transition between gaits. The mechanical function of the animal is therefore determined both by its own thermodynamic characteristics and by the metabolic operating point of the system.
| 
 |
|:–:|
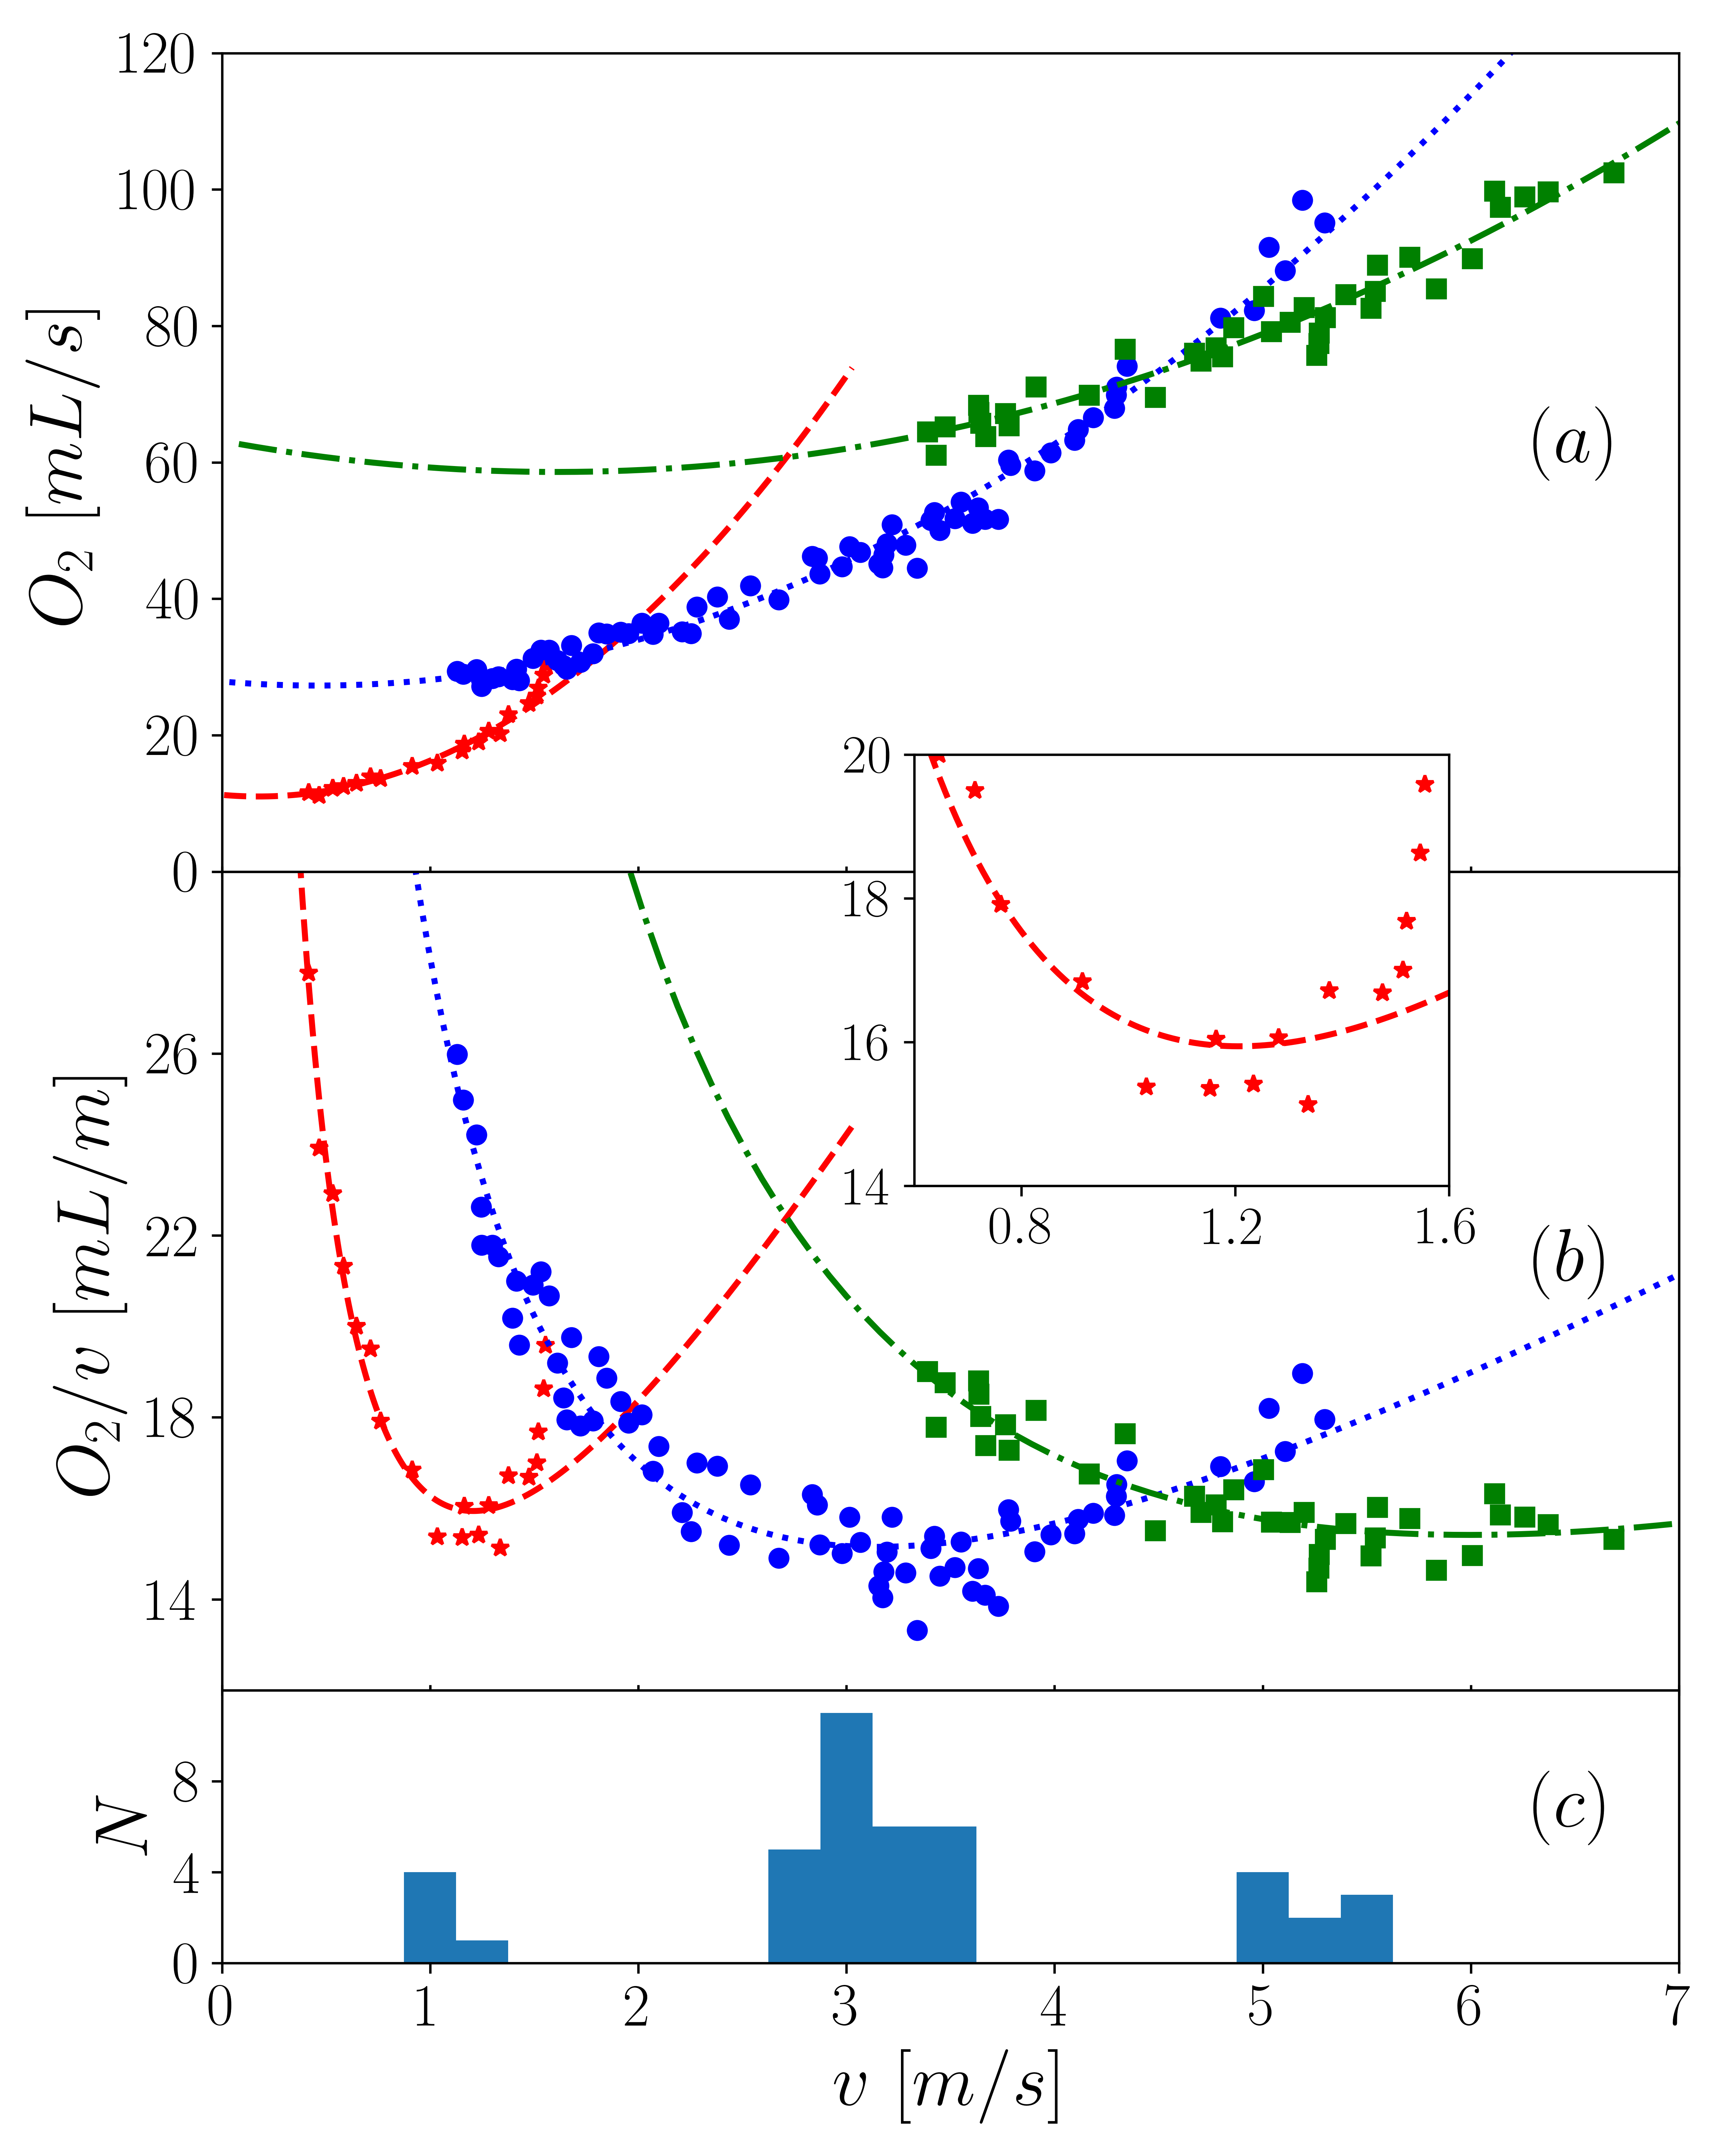
| *Top: experimental data and
obtained fit with the proposed modeling.
On top is plotted the oxygen flux \(\Phi_{O_{2}}\)
while in the middle plot is presented \(COT \equiv \Phi_{O_ {2}}/v\) (which depends on the speed of displacement) respectively for walk (red stars), trot (blue circles) and gallop (green squares).
The dotted curves are the fit obtained from the model.
Left: experimental data from\,\cite{Hoyt1981} (horse B) and
obtained fit with the proposed modeling.
On top is plotted the oxygen flux \(\Phi_{O_{2}}\)
while in the middle plot is presented \textit{COT}\(\equiv \Phi_{O_ {2}}/v\) (which depends on the speed of displacement) respectively for walk (red stars), trot (blue circles) and gallop (green squares).
The dotted curves are the fit obtained from the model.
Note (in inset) the COT dramatic increase for the high velocity walk: this slope change marks the change of regime in this region (these points were not used for curve fit, see text.)
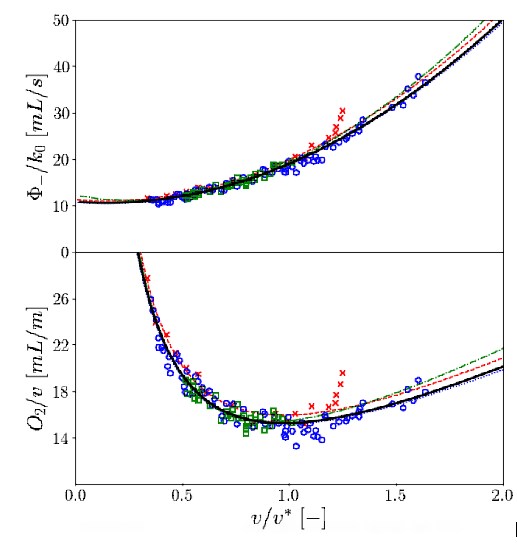
On the Bottom, on top is plotted \(N_0\varphi_{-}/M\) while at the bottom is plotted specific COT\(/M\) and based on \(v/v^{*} \propto i_M\); \(M = 140kg\) is the mass of the horse. In both cases, the thick dark line is a 2-parameter fit of the aggregated data (see text). All gaits are considered as a collection of a different number of activated muscle units.
In inset is shown the relative value of \(N\), \({N_0}/{N}\).
The walk was chosen as a reference gait (\(X_ {0}\)); \({v_ {0}^{*}}/{v^{*}}\) is represented
in \(\bullet\) blue, \({B_{v0}}/{B_{vb}}\) in red \(+\), and
\({R_ {vb}}/{R_ {v0}}\) with dark \(\star\).
The line \(1/v^{*}\) (red dotted line) has been drawn as a guide for the eyes for comparison purposes.
Note (in inset) the COT dramatic increase for the high velocity walk: this slope change marks the change of regime in this region (these points were not used for curve fit, see text.)
On the right, on top is plotted \(N_0\varphi_{-}/M\) while at the bottom is plotted specific COT\(/M\), and based on \(v/v^{*} \propto i_M\); \(M = 140kg\) is the mass of the horse. In both cases, the thick dark line is a 2-parameter fit of the aggregated data (see text). All gaits are considered as a collection of a different number of activated muscle units.
In inset is shown the relative value of \(N\), \({N_0}/{N}\).
The walk was chosen as a reference gait (\(X_ {0}\)); \({v_ {0}^{*}}/{v^{*}}\) is represented
in \(\bullet\) blue, \({B_{v0}}/{B_{vb}}\) in red \(+\), and
\({R_ {vb}}/{R_ {v0}}\) with dark \(\star\).
The line \(1/v^{*}\) (red dotted line) has been drawn as a guide for the eyes for comparison purposes. * |
|
|:–:|
| *Top: experimental data and
obtained fit with the proposed modeling.
On top is plotted the oxygen flux \(\Phi_{O_{2}}\)
while in the middle plot is presented \(COT \equiv \Phi_{O_ {2}}/v\) (which depends on the speed of displacement) respectively for walk (red stars), trot (blue circles) and gallop (green squares).
The dotted curves are the fit obtained from the model.
Left: experimental data from\,\cite{Hoyt1981} (horse B) and
obtained fit with the proposed modeling.
On top is plotted the oxygen flux \(\Phi_{O_{2}}\)
while in the middle plot is presented \textit{COT}\(\equiv \Phi_{O_ {2}}/v\) (which depends on the speed of displacement) respectively for walk (red stars), trot (blue circles) and gallop (green squares).
The dotted curves are the fit obtained from the model.
Note (in inset) the COT dramatic increase for the high velocity walk: this slope change marks the change of regime in this region (these points were not used for curve fit, see text.)
On the Bottom, on top is plotted \(N_0\varphi_{-}/M\) while at the bottom is plotted specific COT\(/M\) and based on \(v/v^{*} \propto i_M\); \(M = 140kg\) is the mass of the horse. In both cases, the thick dark line is a 2-parameter fit of the aggregated data (see text). All gaits are considered as a collection of a different number of activated muscle units.
In inset is shown the relative value of \(N\), \({N_0}/{N}\).
The walk was chosen as a reference gait (\(X_ {0}\)); \({v_ {0}^{*}}/{v^{*}}\) is represented
in \(\bullet\) blue, \({B_{v0}}/{B_{vb}}\) in red \(+\), and
\({R_ {vb}}/{R_ {v0}}\) with dark \(\star\).
The line \(1/v^{*}\) (red dotted line) has been drawn as a guide for the eyes for comparison purposes.
Note (in inset) the COT dramatic increase for the high velocity walk: this slope change marks the change of regime in this region (these points were not used for curve fit, see text.)
On the right, on top is plotted \(N_0\varphi_{-}/M\) while at the bottom is plotted specific COT\(/M\), and based on \(v/v^{*} \propto i_M\); \(M = 140kg\) is the mass of the horse. In both cases, the thick dark line is a 2-parameter fit of the aggregated data (see text). All gaits are considered as a collection of a different number of activated muscle units.
In inset is shown the relative value of \(N\), \({N_0}/{N}\).
The walk was chosen as a reference gait (\(X_ {0}\)); \({v_ {0}^{*}}/{v^{*}}\) is represented
in \(\bullet\) blue, \({B_{v0}}/{B_{vb}}\) in red \(+\), and
\({R_ {vb}}/{R_ {v0}}\) with dark \(\star\).
The line \(1/v^{*}\) (red dotted line) has been drawn as a guide for the eyes for comparison purposes. * |